How to make beautiful electrostatic potential maps and NCI interactions
Published:
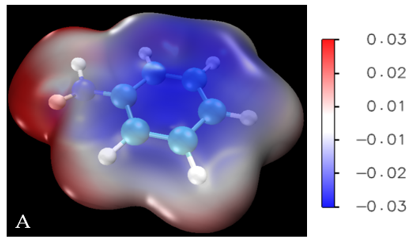
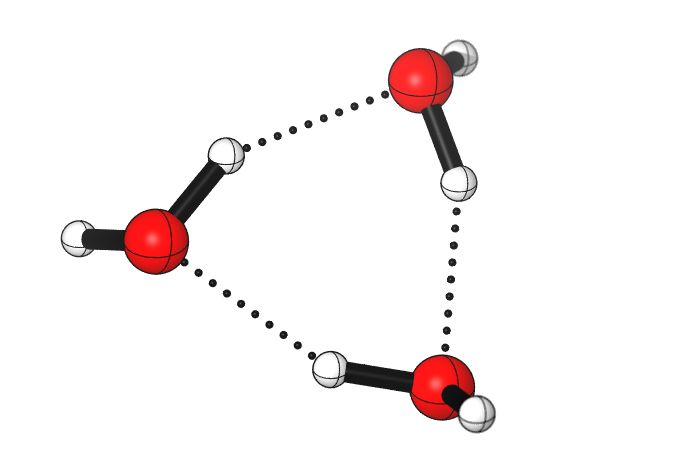
Recently some people asked me how to make a picture of electrostatic potential map as shown in Figure 6 in my 2020 JACS paper. Although I think I could have made a more beautiful picture there… Some people are also interested in drawing the non-covalent interactions.
So the protocols I used for making them are from the tutorials written by Dr. Tian Lu, see here and here. You will need the Multiwfn and VMD program. Although it’s in Chinese but using Google translator in Chrome browser can easily help the reading, before Trump moves to ban all Chinese websites of course. Those are very detailed tutorials so I do not intend to add anything else here. Be sure to cite the papers mentioned in those tutorials properly.
By the way, Dr. Tian Lu also has two videos showing the steps about plotting the electrostatic potential map and non-covalent interactions, which includes basically all the information step by step. You can check them via here and here respectively on Bilibili. Or you can check the tutorials videos on Youtube here and here where the words have been translated into English properly.
I will leave a space here, so if anyone ask me related questions, here I can add more details which not included in those original tutorials.
Q1. How to tune the VMD color scale bar for ions?
For ions, if you use the default color scale bar, the ESP might be completely blue or red, so how to tune the color scale bar for ions?
In VMD, choose “Graphics” then choose “Representations”, selected molecule, choose “0: density1.cub”, in “Trajectory”, change the color scale data range, the default one is -0.03 to 0.03, for cations, for example, we can change to 0.05 to 0.13. You can gradually tune the values to produce the best visulaization for you. Then click “set”. Then choose “Extensions”–“visualization”–color scale bar. set the following options as:
Display title: off
Autoscale: On
Use Molecule: 0: density1.cub
Use Representation: 1:isosurface
Label format: Decimal
Then click “Draw Color Scale Bar”, it will appear on the VMD screen. You can change the mode, for example, changing “Rotate Mode” to “Translate Mode” and then move the color scale bar to the place you like.
Q2. How to make ESP for large systems containing a few hundreds or even more atoms?
If you are using old version of Multiwfn program then probably you can try the most updated one as recently the LIBRETA code developed by Dr. Jun Zhang has been implemented in the Multiwfn, which can dramatically accelerate the process. For details, see here.
If the above is still slow, I recommend using the xtb program together with Multiwfn and VMD. For more information, you can read this blog.
Besides, the Duarte group also presented their strategy using the xtb program. As far as I know, it uses the atomic charge instead of the strict definition of electrostatic potential but the result is good and most important, it’s super quick. So if you are interested, see the tutorial here on Twitter.
Q3. Why my 1.fchk does not work in making ESP?
Because you have to change it to 1.fch.
Q4. Other options?
If you do not want to use the protocols above, there are some other options available.
For ESP, you can use Gaussview, check here for a tutorial on Youtube. Or using Avogadro and Jmol, see this video by Porf. Jan Jensen.
For NCI interactions, you can try NCIplot, see this JCTC paper. AIMALL is also a good choice.
Here’s another web page making many different graphs (electrostatic potential surface, NCI, spin density, etc) using cube files.
But I personally think VMD is the best in terms of visualization.
Here’s an example of ESP for one of my current project